


|
|
|
|
|
 |
|
2.6
PHYSICAL AND SOCIAL |
|
A.
Physical Infrastructure
|
|
|||||||||||||||||||||||||||||||||||||||||||||||
 |
|
|||||||||||||||||||||||||||||||||||||||||||||||
|
City Ring Roads: Two ring roads are
proposed within the City area, one circumscribing the four main use zones
and the other adjoining the utility zone which is designated as the Crown
road. The right of way of these roads is also suggested to be 30 m. These
two ring roads will help in distributing the traffic to the different
zones. |
|
|||||||||||||||||||||||||||||||||||||||||||||||
|
Internal Distribution Roads: The internal
distribution roads consist of vehicular roads as well as pedestrian and
cycle paths. The rights of way of vehicular roads would vary between 18-24
mt. depending upon their functions. |
||||||||||||||||||||||||||||||||||||||||||||||||
|
|
|
|||||||||||||||||||||||||||||||||||||||||||||||
|
2.6.1 In addition to the main categories of roads discussed above, two bypass roads are also suggested, one in the north and another in the south of the township to facilitate diversion of traffic not bound for Auroville. The planning and construction of these roads as well as the main access roads up to the service nodes need to be taken up by the concerned departments of the State Government for providing efficient linkages to the township. |
|
|||||||||||||||||||||||||||||||||||||||||||||||
|
2.6.2 Water Supply: The Auroville region gets an average rainfall of around 120 cm/annum (as observed during the years 1972-83), as per the following distribution given in Table 16:
|
|
|||||||||||||||||||||||||||||||||||||||||||||||
 |
|
|||||||||||||||||||||||||||||||||||||||||||||||
|
2.6.3 In spite of such a good amount of rainfall, the water situation in the region is not satisfactory because of excessive runoff, limited surface storage and inadequate knowledge of aquifer storage areas. Evaporation losses are also considerable due to high average temperatures in the area which go up to 38.8oC in June. Hydro-geological studies made so far revealed that there is adequate potential for groundwater supply of good-quality potable water as long as there is no saline intrusion due to over-extraction. These studies also revealed that water could be tapped both from open wells (3 to 12 m. below ground level) and tube wells. The estimated total yield from rainwater is 25.48 million cu.m. The runoff itself when harvested is estimated between 7.70 million cu.m and 2.84 million cu.m giving an average of 5.28 million cu.m. |
|
|||||||||||||||||||||||||||||||||||||||||||||||
|
2.6.4 The demand for drinking water for Auroville will depend on population and level of supply. Estimates of the water supply needs for Auroville under varying per capita standards for a population of 15,000 in the first phase and 50,000 in the ultimate phase is given in Table 17:
|
|
|||||||||||||||||||||||||||||||||||||||||||||||
|
2.6.5 The annual requirement will range from 0.383 million cu.m to 3.650 million cu.m.. It is therefore clear that the per capita requirement should be established in such a way that the extraction is within safe limits of availability, taking into consideration that the rainfall will not be uniform in all years, and the possibilities of over-extraction and some extraction for irrigation purposes. Taking note of the fact that Auroville envisages development of less water consuming industries, national and international pavilions and cultural facilities of high order which occupy nearly 25% the developed area, it is therefore proposed to adopt the standard of 200 lpcd to meet the total requirements of the township. The component for residential supply will be only 135 lpcd. The annual water requirements for a population of 15,000 would therefore be about 3 million litre per day or 1.1 million cu.m. per year. Auroville's work in water management so far has been characterised by principles of zero runoff, conservation, and recycling and re-use of waste water. This work will be intensified so that additional requirements would be largely met through the recycling of waste water. Auroville will thus be able to meet all its water requirements comfortably, both in the first phase and the ultimate phase. |
|
|||||||||||||||||||||||||||||||||||||||||||||||
|
2.6.6 Water Supply Distribution: A predominantly decentralised system of extraction and distribution eminently fits the land use plan proposed for Auroville. Each of the principal zones will be supplied from local tube wells located in the particular zone itself or in the Green Belt adjoining the zone. The distribution system will also be localised for each zone. This will not only reduce the costs of laying long lengths of high diameter pipes, but also assist in recycling waste water for garden and other non-drinking uses close to the zone itself. |
||||||||||||||||||||||||||||||||||||||||||||||||
|
2.6.7 Sewerage and sanitation: Auroville has been experimenting with septic tanks, Imhoff tanks (both individual and at community level), leach pits and root-zone treatment of sewage for compact communities. The use of such facilities will continue in the Cultural and International Zones as well as in the Green Belt developments. Separate, partially centralised systems of collection and treatment will be considered only for the Industrial and Residential Zones to avoid contamination of groundwater. |
|
|||||||||||||||||||||||||||||||||||||||||||||||
|
2.6.8 The approach to sanitation will be through the use of a variety of night soil disposal methods, which include toilets/latrines of various designs and disposal methods. These will include FOLs connected to individual or community treatment facilities. Extreme care will be taken to see that these systems do not pollute the underground water resources on which Auroville and its neighbourhood depend. |
||||||||||||||||||||||||||||||||||||||||||||||||
|
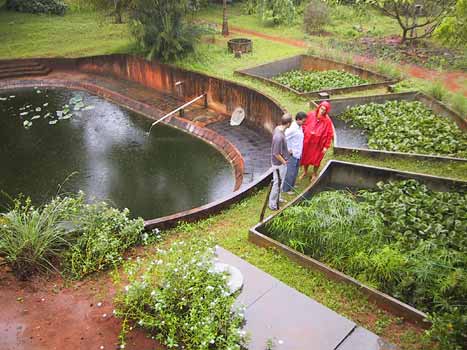
2.6.9 Drainage: A storm water drainage system will be provided to fully support the "zero runoff" concept. Already many check dams across the canyons and earthen dams along and across roads divert the runoff into the ground below. In addition, Auroville is exploring rooftop water harvesting, as well as a proposal for a major water management project which involves collecting the excess runoff within the Green Belt and pumping it out to a central lake that is to be created. The infiltration from the lake would regularly recharge the aquifers and prevent saline intrusion into the aquifers due to over-extraction that may occur outside Auroville. The western part of the Green Belt, extending from Alankuppam village to Irumbai village, is a good aquifer recharge and storage area, which can be used for water recovery when needed. These proposals will have greater relevance for the ultimate phase, but studies have already been commenced to explore them. |
|
|||||||||||||||||||||||||||||||||||||||||||||||
|
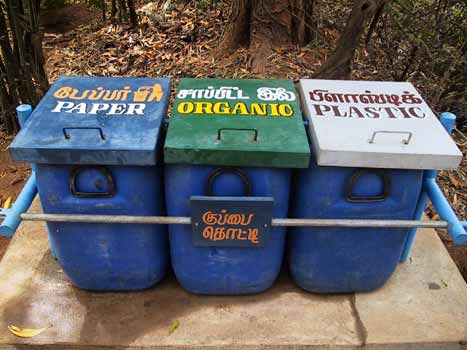
2.6.10 Solid Waste Management: Solid waste management in Auroville presently consists of sorting at source, efficient collection and recycling of both organic and non-organic wastes. Incinerable wastes are burnt at 800°C in a two-chambered LPG-fuelled incinerator at the Auroville Health Centre. Some of the non-recyclable wastes like batteries, rubber items, thermocole, film, glass and PET are stored in a special storage facility until a market or acceptable environment-friendly disposal solution is found. |
|
|||||||||||||||||||||||||||||||||||||||||||||||
|
2.6.11 The first-phase developments are anticipated to generate about 7 to 12 tons of waste based on a per capita generation of 0.5 to 0.75 kg. This would include garden wastes within the City Area, but excludes wastes from the Green Belt. The waste generated in the Green Belt would be utilised either as biomass fuel for producing electricity, or for conversion into soil nutrients and enrichers. The strategy and approach to solid waste management will include: |
||||||||||||||||||||||||||||||||||||||||||||||||
|
|
|||||||||||||||||||||||||||||||||||||||||||||||
 |
|
|||||||||||||||||||||||||||||||||||||||||||||||
|
2.6.12 Sewerage and sanitation: Auroville with its past experience will initiate and promote the "zero-garbage" concept to the maximum, so that no dumping or sanitary landfill is needed. Transportation of solid waste for disposal will also be minimal. |
|
|||||||||||||||||||||||||||||||||||||||||||||||
|
2.6.13 Power-Energy-Telecommunication: Concerned with the ecological implications of energy consumption, Auroville has been experimenting from the beginning with the use of renewable energy sources such as sun and wind that are continuously available, as opposed to fossil fuels (coal, oil, etc.). Auroville's vision is to become energy independent and self-sufficient, with all its energy requirements met from renewable sources. |
||||||||||||||||||||||||||||||||||||||||||||||||
|
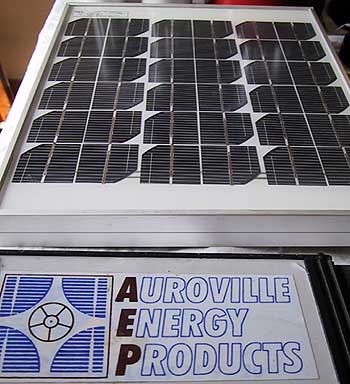
2.6.14 Already 150 houses use solar photovoltaic electricity and solar water heaters for their energy requirements. There are about 140 solar water pumping systems and 30 wind pumps operational in Auroville for gardening and irrigation purposes. Specially designed ferro-cement biogas systems process animal and vegetable wastes to produce methane gas for cooking and organic fertilizer. |
|
|||||||||||||||||||||||||||||||||||||||||||||||
|
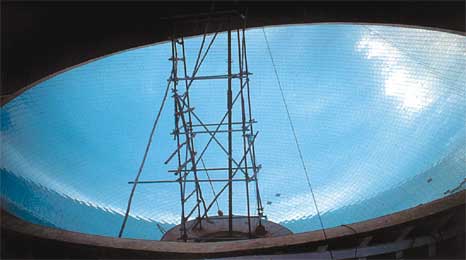
2.6.15 Auroville in co-operation with Government of India Departments has installed a 36.3 KW solar photovoltaic power plant close to the Matrimandir, which is the largest stand-alone solar power plant in the country. A unique solar bowl has also been installed on the roof of the Solar Kitchen, which generates enough energy to cook meals for about 1,000 persons a day for the Auroville community. |
|
|||||||||||||||||||||||||||||||||||||||||||||||
|
|
|
|||||||||||||||||||||||||||||||||||||||||||||||
|
2.6.16 Expanding
the use of renewable resources is possible because of five workshops in
Auroville which produce and market different types of renewable energy
systems. However, due to limitations of technology and high cost, Auroville
will have to draw its major power requirements for the first phase from
the Tamil Nadu Electricity Board grid. Auroville is now drawing 2.1 million
KW of power per year from TNEB and its demand in the first phase would
be in the order of 20 million KW per year based on the present per capita
energy consumption. Conservation measures are expected to bring this down
to about 14 million KW. In order to fulfil its energy objectives Auroville
is considering two important avenues: |
||||||||||||||||||||||||||||||||||||||||||||||||
2.6.17 Solar photovoltaics
will serve as the main energy source, backed up by the Tamil Nadu Electricity
Board (TNEB). Alternative sources of energy will be incorporated. Solar
panels will be installed on the rooftops. Auroville's approach would consists
of both Demand Side Management (reducing wastage) and Supply Side Management
from renewable sources of energy. |
|
|||||||||||||||||||||||||||||||||||||||||||||||
 |
|
|||||||||||||||||||||||||||||||||||||||||||||||
|
2.6.18 The requirement
of 10,000 telephone lines for Auroville is based on the fact that it will
have a proportionately larger number of resource persons engaged in several
activities of sustainable development which naturally means that use of
computers would be more or less universal. Accordingly, the Auroville
Telephone Service is negotiating with the Department of Telecommunications
to fulfil its future requirement of 10,000 telephone lines. |
|
|||||||||||||||||||||||||||||||||||||||||||||||
|
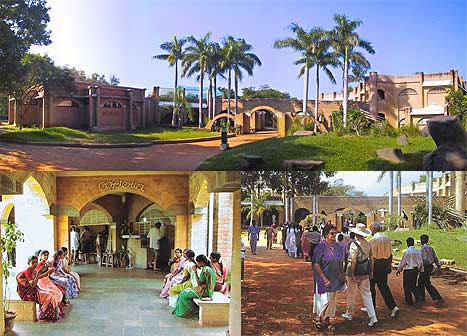
2.6.19 The social infrastructure in Auroville will consist of two distinct parts namely the facilities needed by the residential population (which is predominantly located in the Residential Zone) and the other facilities that will be part of the main function of the Auroville Universal Township. The latter will be located mainly in the International and Cultural Zones. The social infrastructure required for serving the residential population is proposed to be at four levels namely, |
|
|||||||||||||||||||||||||||||||||||||||||||||||
2.6.20 The social infrastructure has been worked out for a population of 15,000 Aurovilians that is to be achieved in the first phase. The facilities indicated under City/District level have been worked out for a population of 15,000, but will also serve the needs of a bigger population as the city grows. During periodical review, the infrastructure requirement for the increasing population would be assessed in the development plan after every five years and provided as per necessity. |
|
|||||||||||||||||||||||||||||||||||||||||||||||
|
2.6.21 Details of such facilities proposed at the four levels mentioned above, as well as the summary of land requirements for the social facilities for a population of 15,000 in the Residential Zone are indicated in the Tables 18 and 19. The allocation of land for various categories of facilities would be worked out on the basis of UDPFI guidelines. |
|
|||||||||||||||||||||||||||||||||||||||||||||||
|
||||||||||||||||||||||||||||||||||||||||||||||||||||||||||||||||||||||||||||||||||||||||||||||||||||||||||||||||||||||||||||||||||||||||||||||||||||||||||||||||||||||||||||||||||||||||||||||||||||||||||||||||||||||||||||||||||||||||||||
|
||||||||||||||||||||||||||||||||||||||||||||||||||||||||||||||||||||||||||||||||||||||||||||||||||||||||||||||||||||||||||||||||||||||||||||||||||||||||||||||||||||||||||||||||||||||||||||||||||||||||||||||||||||||||||||||||||||||||||||
|
|