


|
|
|
|
|
 |
|
1.6 DEMOGRAPHIC CHARACTERISTICS |
||
|
1.6.1 By the very concept of the town as a Universal Township focused on spiritual and material researches and development, only those who aspire to be 'willing servitors of the Divine Consciousness', are attracted to become its citizens. Therefore, the normal demographic process of growth does not apply to Auroville. It is in this background that the demographic characteristics of the township need to be seen. |
|||||||||||||||||||||||||||||||||||||||||||||||||||||||||||||||||||||||||||||||||||||||||||||||||
|
|
|
||||||||||||||||||||||||||||||||||||||||||||||||||||||||||||||||||||||||||||||||||||||||||||||||
|
1.6.2 The
present population of Auroville consists of: |
|
||||||||||||||||||||||||||||||||||||||||||||||||||||||||||||||||||||||||||||||||||||||||||||||||
 |
|||||||||||||||||||||||||||||||||||||||||||||||||||||||||||||||||||||||||||||||||||||||||||||||||
|
|
|||||||||||||||||||||||||||||||||||||||||||||||||||||||||||||||||||||||||||||||||||||||||||||||||
 |
|
||||||||||||||||||||||||||||||||||||||||||||||||||||||||||||||||||||||||||||||||||||||||||||||||
|
Note: There is an increase of about 12% over the previous year. |
|
||||||||||||||||||||||||||||||||||||||||||||||||||||||||||||||||||||||||||||||||||||||||||||||||
|
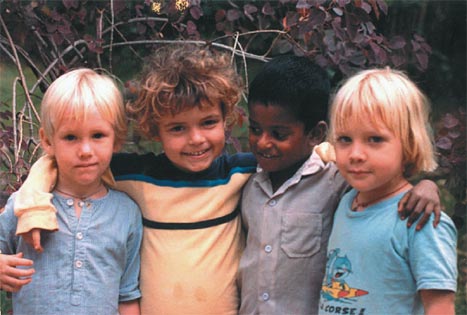
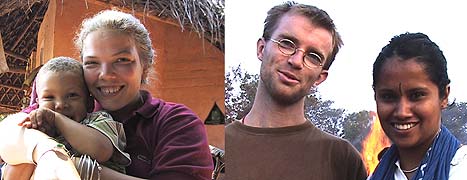
1.6.4 Resident
Aurovilians: There are at present 1519 Aurovilians from various nationalities,
including a substantial number of Indians. Table 2 indicates the
nationalities constituting the Auroville population. The population growth
till now has been rather slow. However, it may be observed that since
a critical mass has already been formed and the development activities
are picking up, Auroville will attract a large number of people from various
countries in the years to come. In this context, it may also be mentioned
that a number of international centres have been set up in different countries,
and it is proposed to set up similar centres in the different states of
India. These centres will disseminate information about Auroville, thereby
raising awareness and attracting resource persons in larger numbers for
the expansion of the present activities of Auroville. |
|
||||||||||||||||||||||||||||||||||||||||||||||||||||||||||||||||||||||||||||||||||||||||||||||||
 |
|||||||||||||||||||||||||||||||||||||||||||||||||||||||||||||||||||||||||||||||||||||||||||||||||
|
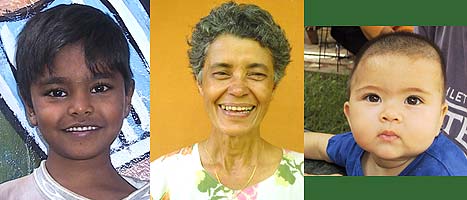
1.6.5 Students
and Researchers: Nearly 100 students and researchers are in Auroville
at any given point of time. As Auroville grows, the number of students
and researchers will also grow. These students come from all over the
world and are committed youth, who want to learn and use their knowledge
in various fields in which they are interested. Their interest ranges
from art and architecture to various other disciplines and their application
to sustainable development. The estimated number of researchers is 1,200
annually. |
|
||||||||||||||||||||||||||||||||||||||||||||||||||||||||||||||||||||||||||||||||||||||||||||||||
|
|
|||||||||||||||||||||||||||||||||||||||||||||||||||||||||||||||||||||||||||||||||||||||||||||||||
|
1.6.6 Day-workers:
Auroville provides work opportunities to about 5,000 persons residing
in its neighbourhood in both manufacturing units and services. These workers
have their own houses in the surrounding villages and as such return in
the evening to their homes. The break up of day-workers engaged in manufacturing
and services is given in Table 3. Nearly 48% of the day-workers
in manufacturing and services are female workers, indicating a higher
participation ratio of women in the workforce. |
|
||||||||||||||||||||||||||||||||||||||||||||||||||||||||||||||||||||||||||||||||||||||||||||||||
 |
|||||||||||||||||||||||||||||||||||||||||||||||||||||||||||||||||||||||||||||||||||||||||||||||||
|
1.6.7 Casual Visitors: Matrimandir is the main attraction to visitors from outside and, on an average, 1,000 persons visit it every day. Sundays and holidays are special days when the number of visitors go up to 2,000 persons. Basic facilities such as parking of vehicles and information centres are available for their use. Apart from such visitors, students and professionals come to Auroville to learn about its activities, and attend workshops and seminars. The number of visitors for such purposes on an average varies from 50 to 75 persons at any given point of time and this is bound to increase in the future. Guesthouse facilities are available for the visitors. The number of casual visitors is estimated at 2.5 lakh/year. |
|
||||||||||||||||||||||||||||||||||||||||||||||||||||||||||||||||||||||||||||||||||||||||||||||||
|
1.6.8 The
age and sex composition of the Resident Aurovilian population indicates
that about 70% of the resident population is in the active age group.
About 20% of population is comprised of school going children. Although
6% of the resident population is above 60 years of age, they are also
considered to be active workers in their respective fields. The ratio
of women to men is 881 to 1,000, but varies from time to time. Table
4 indicates the age composition of Aurovilians. |
|
||||||||||||||||||||||||||||||||||||||||||||||||||||||||||||||||||||||||||||||||||||||||||||||||
|
|
||||||||||||||||||||||||||||||||||||||||||||||||||||||||||||||||||||||||||||||||||||||||||||||||
* Press on each photo area, to open the whole photo 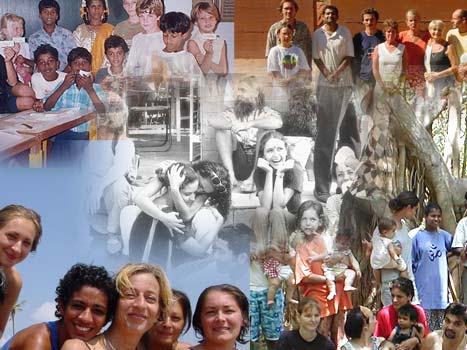 |
|
||||||||||||||||||||||||||||||||||||||||||||||||||||||||||||||||||||||||||||||||||||||||||||||||
|
1.6.9 In the
absence of specific data on occupational structure it may not be possible
to indicate the detailed employment pattern in the township. However,
the majority of the resident population is engaged in farming, services,
professional skills and entrepreneurial activities as given in Table
5. |
|||||||||||||||||||||||||||||||||||||||||||||||||||||||||||||||||||||||||||||||||||||||||||||||||
|
|
|||||||||||||||||||||||||||||||||||||||||||||||||||||||||||||||||||||||||||||||||||||||||||||||||
|
|